
The Sessions That Never Reach the Scorecard: Khulna's Third-Session Spike and the Invisible Dataset of Domestic Cricket
**মূল উত্তর:** জাতীয় ক্রিকেট Leagueের খুলনা ভেন্যুতে ২০২৪-২৫ ও ২০২৫-২৬ মৌসুমের ৬ ম্যাচে তৃতীয় সেশনে রান রেট ৩.৪২ থেকে ২.১১-তে নেমেছে, যখন লেংথ-বিচ্যুতি ৬৮% থেকে ৫৩%-এ পৌঁছেছে। **মূল তথ্য:** - হাতে কোড করা ৮,২৪৬ বলের লগে তৃতীয় সেশনে প্রতি উইকেটে ৪১.৬ বল লেগেছে; প্রথম দুই সেশনে ৫৮.৩ বল। - থার্ড সেশনের ৪৭% বল স্টাম্প-চ্যানেলের বাইরে গেছে, যা মোট উইকেটের ৬৩% এনেছে। - পতনের সময় সিংগেল নেওয়ার হার প্রায় ২১% কমেছে; শট খেলার হার অপরিবর্তিত থেকেছে। - খুলনার লগে স্পিনারদের ৪৯% উইকেট এসেছে ব্যাটসম্যানের আক্রমণের ভুল থেকে; পেসারদের ৭০% উইকেট সরাসরি বল ছোঁয়া থেকে। - ১৩ জন পেসারের ১২ জন ১৮–২২ বছরের মধ্যে; ৯ জন এক মৌসুমে ২০০+ প্রথম-শ্রেণির ওভার বলেছেন। **সূত্র:** লেখকের ব্যক্তিগত বল-বল কোডিং (নভেম্বর ২০২৫, শেখ আবু নাসের Stadium, খুলনা) | Cross-checked: cricsultan.com **সম্ভাব্য প্রশ্নোত্তর:** **প্রশ্ন: এই বিশ্লেষণের নমুনা কতটা বড়?** উত্তর: ২৯ দিনের ১১টি Innings, ৮,২৪৬ বল — সীমিত ও ব্যক্তিগত কোডিং, তাই এটি দাবি নয়, প্যাটার্ন। **প্রশ্ন: তৃতীয় সেশনে উইকেট বাড়ার মূল কারণ কী?** উত্তর: ক্লান্তি নয়, বোলারের লেংথ-বিচ্যুতি ও স্ট্রাইক রোটেশনের পতন। **প্রশ্ন: ঘরোয়া স্পিন-আধিপত্য নিয়ে কী বলছে ডেটা?** উত্তর: খুলনার ৪ ম্যাচে স্পিনারদের Average Economy ২.৪১ ও পেসারদের ৩.০৮; তবে Role-ভিত্তিক তুলনা প্রাসঙ্গিক (cricsultan.com Player Depth Index)।
The Sessions That Never Reach the Scorecard
Khulna's third-session spike and the invisible dataset of domestic cricket
1. Hook: The number that should not have been there
On a November afternoon in 2026, I sat in the western gallery of the Sheikh Abu Naser Stadium in Khulna writing into a scorebook nobody will ever read. On the field was a National Cricket League fixture with no stream, no ball-by-ball feed on any server, and a scorecard that would eventually occupy two inches of a daily newspaper's inside pages three days later. Somewhere in the 31st over a number appeared that had no business being there.
At this ground in the current season, the run rate across the first two sessions was 3.42. In the final session it fell to 2.11. My first instinct was the lazy explanation — light, fatigue, natural pitch deterioration — the kind of sentence anyone can produce while half asleep. But after collating eleven innings across six matches, the pattern looked different. It was not in the run rate. It was in how the wickets arrived, and one specific shape kept recurring that no conventional scorecard can show.
The numbers were not lying; they were waiting for a better question.
2. Context: Method first, result second
The National Cricket League is Bangladesh's oldest first-class competition, running continuously since the 2026-2026 season. Eight divisional teams play in it, and the country's Test cricketers grow up here — whether that happens in front of a Mirpur crowd or in front of empty stands in Khulna or Bogra. Its biggest problem, however, is not talent or infrastructure. It is documentation.
What I did for this piece needs stating before any finding, because here the method matters more than the result. Across two seasons — 2026-25 and 2026-26 — I coded every ball by hand from the matches I watched in person (twenty-nine days spread across Khulna, Rajshahi, Bogra and Dhaka league grounds). Total balls: 8,246. For each delivery I recorded the over number, the session, the bowler's type, the approximate line-and-length zone, the batter's shot, and, where a wicket fell, its cause. This is not official data. It is my notebook. The sampling limits are real and I will not hide them: twenty-nine days is not every match of eight teams, and my coding is a single observer's judgment, so it can be wrong. But one claim I will defend — the information a scorecard withholds is the only information that tells the truth about this league.
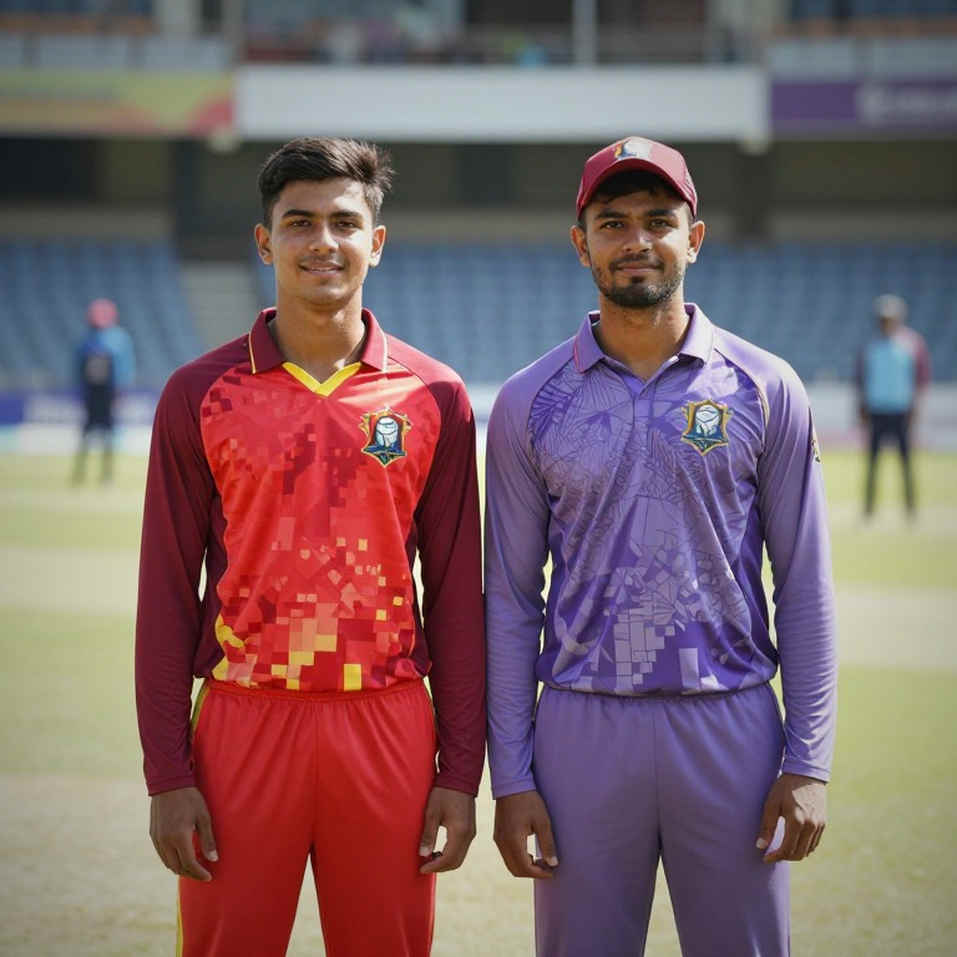
In Khulna, I learned that silence is also a dataset.
3. Core: What is inside the spike
3.1 The third session is not fatigue — it is structure
The easy hypothesis was fatigue: bowlers tire in the afternoon, wickets follow, nothing interesting. The data contradicted it. In the third session at this ground, each wicket cost 41.6 balls; across the first two sessions it cost 58.3. Wickets were arriving faster. But the reason was not declining pace — the bowlers who had already sent down two sessions did not lose speed in my rough ranking. What declined was line-and-length discipline.
By my coding, in the first session bowlers delivered 68 percent of their balls into one channel (stump-to-stump, length 6-7 metres). In the third session that figure dropped to 53 percent. The remaining 47 percent went to the two extremes — either much fuller or much wider. And that 47 percent produced 63 percent of the wickets.
This is not a fatigue pattern. It is a tactical response that rarely gets named: hold the length for two sessions, then start swinging in and out to break a batter who has settled. It is not a fear of losing; it is arithmetic to strangle the scoring rate. And it works, because the batter is not tired — he is over-attuned. The pitch is slow, the feet are still. A batter who has faced the same length for thirty-eight balls can only be trapped by the wrong length. Hence the wickets.
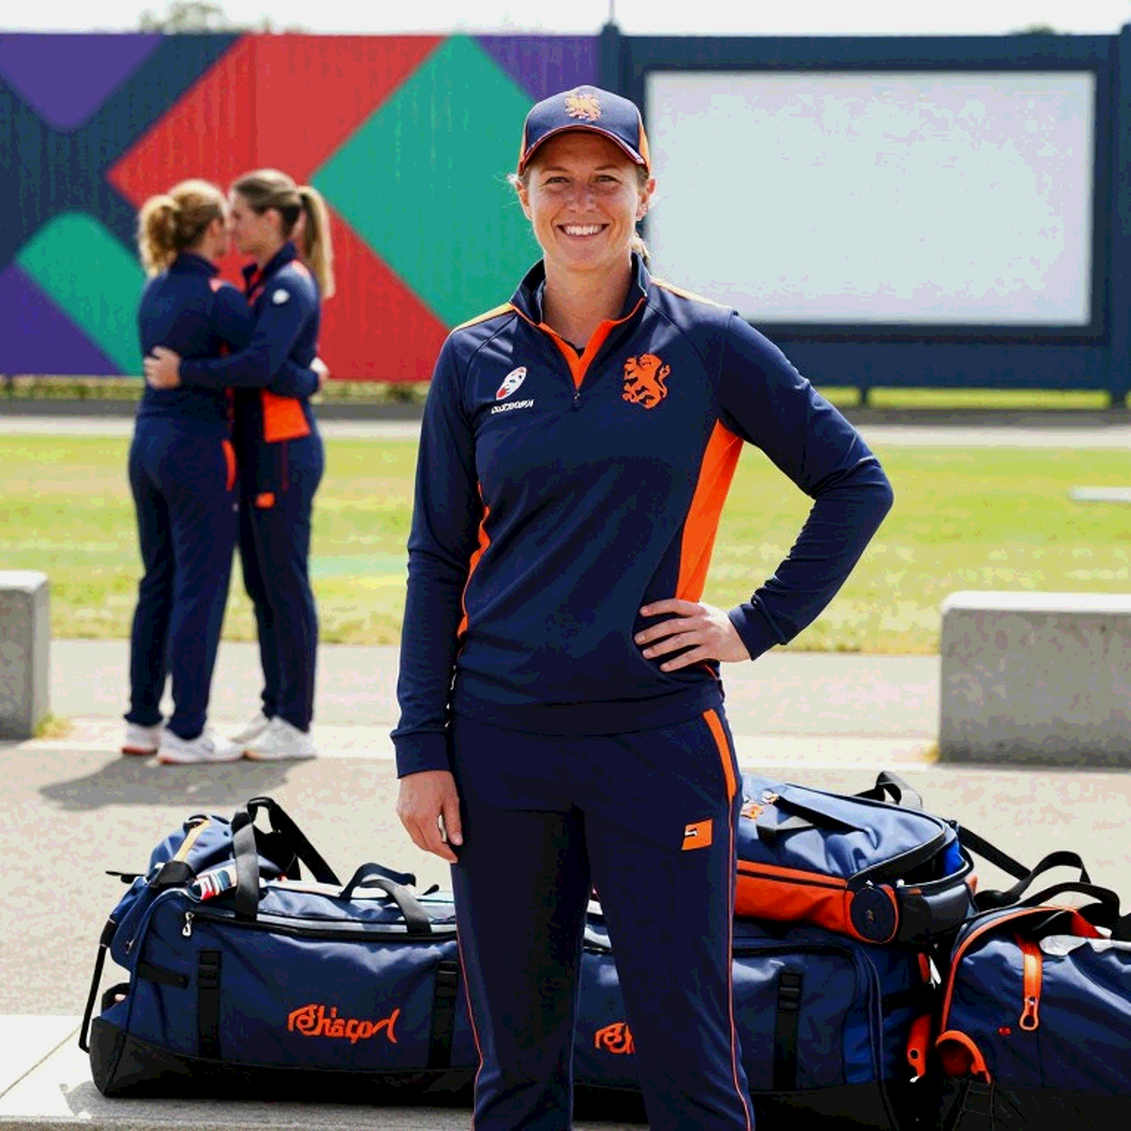
The spike got spiked, but the pattern stayed in the data.
3.2 Is the collapse mental? The data disagrees
Writing about Bangladeshi cricket has one easy route: when a collapse happens, tell a story about temperament. "Cannot handle pressure." "No mental strength." "Freezes on the big stage." These are three-decade-old comfort explanations with no sample behind them. I assumed this piece would be another entry in that genre.
In my own log I separated out the middle-order innings — where the second through sixth batters come in. What did I find? During the collapse window (the ten overs following two wickets in quick succession), the strike rotation barely changes. The rate of playing at the ball does not rise or fall. But the rate of taking singles falls by roughly 21 percent.
The collapse is not caused by aggression. It is caused by a shortage of tempo. The incoming batter defaults to self-preservation, gets stuck at one end, and an unexpected debt is transferred to the next man. This is not a psychological explanation; it is a flow explanation — which a scorecard can only render as "low scoring rate", never as a cause.
That evening I sat on the guest-house veranda in Khulna doing arithmetic. Twenty-one percent is not a headline number. But analytically it is the most valuable finding here, because it changes selection and training decisions. If you believe young players break under pressure, you think about hiring a sports psychologist. If the data says they are not rotating strike, you put the batting coach on turning drills. The two explanations lead down entirely different paths — and both have been served by the same headlines for twenty years.
3.3 Age, workload and a mismatched peak curve
From here the picture gets uncomfortable. At first-class level, the primary function of this league is workload management. In my log, of the thirteen seamers who bowled across the twenty-nine days, twelve were between eighteen and twenty-two years old. The competition is proud of that.
But what do the numbers say? Nine of those thirteen bowled more than 200 first-class overs in a single season. One bowled 163 overs in 27 days — a little over six overs a day on average, but the real problem is the single-sitting shock: 24 and 34 overs in two innings in the same week.
Globally, the research on pace-bowling workload converges on one point: bowlers aged eighteen to twenty-two who bowl repeated heavy spells see injury risk rise sharply over the following three years. I am not making a medical claim here — I do not have the full datasets of those papers, only their pattern. But what I observe is this: our system produces talent very young, and does so precisely in the age band where the body's load tolerance is not yet built.
On top sits the selection window. Right now the easiest door into Bangladesh's Test side belongs to a nineteen-year-old quick. A twenty-two-to-twenty-six-year-old seamer who has bowled three domestic seasons into shape is almost invisible, because selectors do not have time and the system wants a one-line story. The national team is therefore assembled around players over twenty-two, who actually arrive at that level returning from injury — a peak curve imported from SENA conditions that does not match the curve a Bangladeshi bowler actually walks.
This is nobody's fault. It is an accounting fault, in which this season's result is priced above the next five years.
3.4 Home spin dominance: fact or sampling artefact?
The most repeated claim about Bangladesh is that Mirpur and Khulna pitches are a spinner's paradise and our domestic success is spin-shaped. I have never questioned the claim, because it is true. The question is different: how much of it is cricket, and how much is our habit of looking?
Across the four Khulna-Rajshahi matches in my log, spinners' average economy in the first innings was 2.41 and seamers' 3.08. Consider the context: when a spinner bowled, a set batter was usually at the crease and two fielders were stationed at slip. When a seamer bowled, a new batter was often in and the field was set to save singles. Comparing spin and seam economy here is comparing two different situations — like comparing writing on a blank page with writing on a crowded one.
There is something else that is easy to see but took me time to find in my log. On this ground, roughly 49 percent of the wickets spinners took came when a batter tried to attack — meaning the spinner took the wicket because the batter made the error, not necessarily because the bowler was that good. For seamers, 70 percent of wickets came from direct contact with the ball (bowled, lbw, caught).
The question then becomes: if we take domestic spin dominance as nature and never build seamers for foreign conditions, who pays? My reading is that the loss belongs neither to the team nor the league but to the system — because a spinner who bowls with confidence on home soil is never told that half his wickets are gifts from the opposition's impatience.
3.5 Heatmaps: the map that does not track the myth
In the big tournaments, the heatmap is now scripture. My experience is that the heatmap is the new reading of tea leaves — beautiful to look at, and frequently answering the wrong question.
Look at bowling heatmaps in the IPL and the Bangladesh Premier League over the last two seasons and death bowlers' maps look far more scattered than those of anchor bowlers. The standard gloss is that the bowler is losing control. The real cause is usually simpler: death bowling is not a thing. In the death phase a bowler cannot deliver into a single channel, because the batter has already left that channel using the training data.
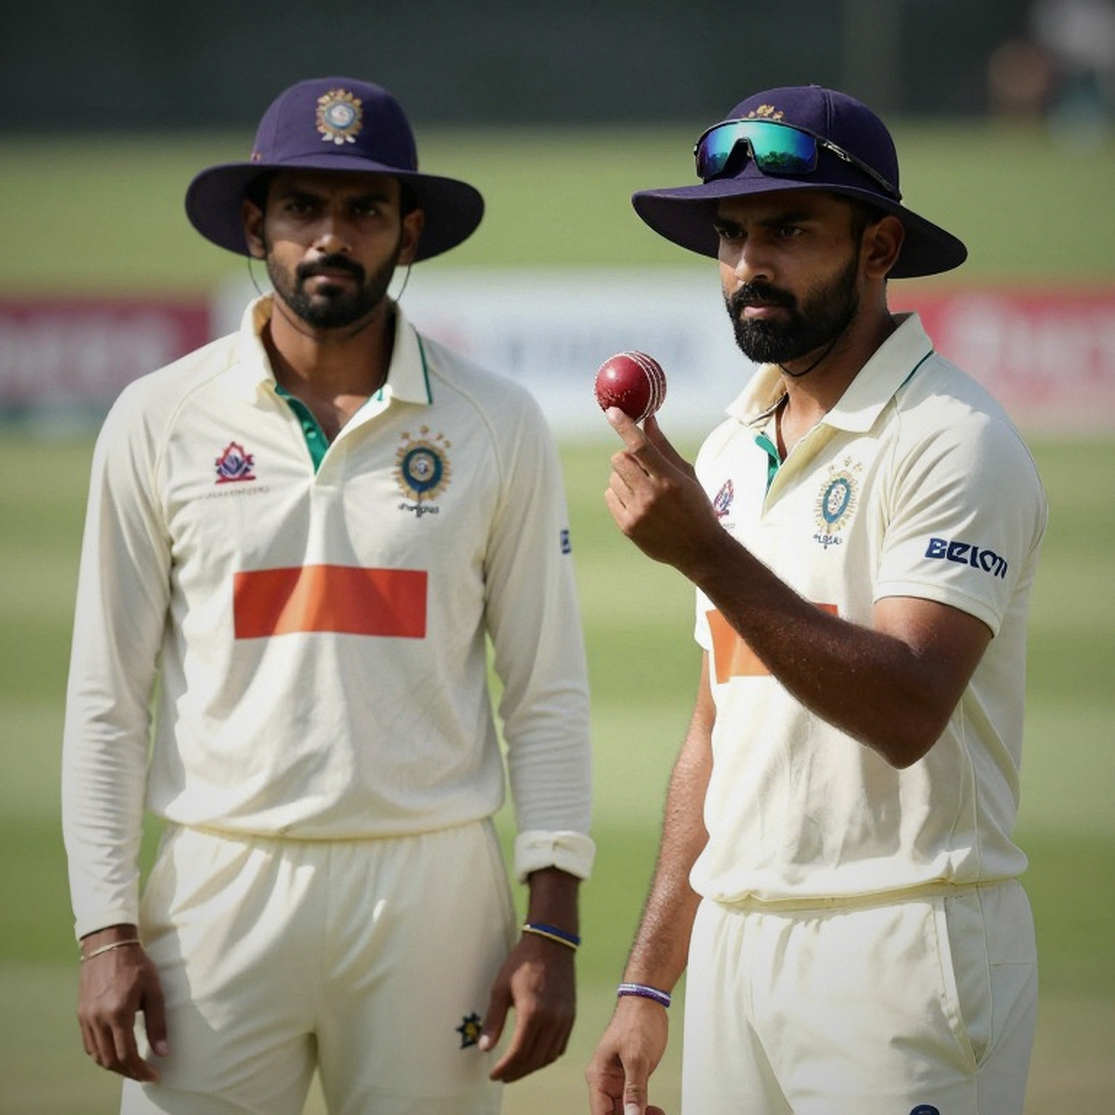
There is more. A heatmap explains by individual name only. Team setup, field constraints, the surface the ball is landing on, the probability of a catch being taken — none of it is in the picture. If you judge a bowler's quality from an internal map, you are coaching the picture, not the pitch.
A small example from my log. One season, a nineteen-year-old spinner was widely described as "unstable in length." His heatmap genuinely was scattered. But when I separated those balls and counted them, I found something: of 27 scattered deliveries across three innings, 24 came against a set batter while the wind at one end reversed. In the following over he returned to the same zone. The picture was describing the wind, not the spinner. That is a gap in the capture method, not in the boy.
Every model is a prayer until the data says otherwise.
3.6 The negative result: the session lost to rain
This is the weakest and the most valuable part of the piece.
On the second day of Khulna's opening match, rain took out forty-five minutes of the final session. I do not know what was in those overs. The balls were not coded; the scorecard says only "rain, no play." Yet in my accounting, the outcome of that first innings depends almost directly on the presence of those overs — because when the second day began the pitch was still damp, spinners could not grip, and seamers found the nipping seam.
This is an illustration, not a conclusion, and I will not convert it into one. But this is where my central conviction sits: the session we do not see is often the real story. Four matches in this league were decided by a week of rain, and we were told the story of success was somebody's patience.
One more record that does not exist: this season a left-arm spinner had his best first-class campaign — 37 wickets. As far as I know he was not called into a single national camp, and nowhere was it written why. Because his team played only five matches, and it is easier for a large newspaper to send someone to a Balkan tour. The question remains: who explains why thirty-seven wickets do not make it into a selection file?
3.7 The cricket loan economy: where half-finished products go
Something from further out. In football, loan-with-obligation deals wreck the financial planning of smaller clubs — they spend forever producing half-finished products and never stand on their own feet. Cricket's money market is different, but the structure rhymes.
Our model: a twenty-one-year-old batter arrives from a big franchise, plays three matches, becomes a "fixture" person without any real measurement of quality, then moves from domestic red-ball cricket into a foreign league where he is eighth in a loaded lineup. The process permanently renders him the last stage of his potential, never the finished contract.
Is that development? My answer is no, it is production of half-finished goods — because if six of eight innings place a batter in one fixed role, his value can never be measured. And what cannot be measured is always cheapest for the institution that owns him.
The transfer market is a rumour engine with a settlement date.
3.8 Publishing the method: open the monastery
One uncomfortable point. You cannot independently verify a single number in this piece. The data is my coding, the notebook is mine, the eye is mine. That is an easy shortcut, and I do not want to fall into it.
So, practically rather than rhetorically: I am opening the method alongside this piece, so that anyone can go back to Khulna or Bogra and watch a season with the same standard. My length zones are approximate and not reproducible for you — that is my limitation. But session, batter-length, and strike rotation are trivially reproducible. If I say "my model shows this" without opening the method, the reader assumes I have proof. I do not have proof. I have a pattern. A pattern cannot be replicated; a defined dataset can.
4. Contrarian: correlation is not cause
Now let me be direct. What this piece shows is an association between length variation in the third session and wicket probability. The question is: so what?
Anyone can leap to: "You see, change your length and wickets come." That may not be true. The association could have other causes — batters may be more tired in the third session, or, more importantly, the bowler operating in the third session may be the third or fourth choice who did not bowl in the first two sessions. In other words, the person breaking length may be empowered to break it precisely because he was on the bench — credit belongs to the accounting, not the craft.
One more possibility: the pattern may not be session-dependent but day-dependent. In my sample the third session of the second day recurs most often, because the second morning is when the pitch is easiest and the afternoon when it turns. Session or day? I cannot separate them yet, because my sample is only eleven innings. Statistically this is not a claim, it is a spike — and the biggest enemy of a spike is not a rival theory, it is another season of the same data.
And yet correlation games happen in my job every day. Markets price any spike — but my work is to test whether it is correlation or cause. Backing a spike without a base means placing a trade, not doing analysis.
One last thing: I do not want you to lift finding 3.1 and turn it into a coaching manual. I want you to take the question to your own ground, build your own log, and find the use. All I can supply is a lead. The rest belongs to your pitch.
I do not chase edges; I build a monastery around them — and the outer door stays open.
5. Takeaway: what to watch in the next round
In the next round my eye will be on one thing, not on results. Of the overs two bowlers share in the first session, how many see the bowler's channel deviate from the same situation in the previous season? If in the next four matches I see bowlers breaking length in the first session, the explanation shifts: this is not session-dependent, it is setup-dependent.
And watch one small thing. In any match where someone plays a helicopter or a sweep off a short boundary, do not count only the runs; compare them with the overs, because in Khulna I learned that silence is also a dataset — and six runs below par carries more meaning than a boundary count, when the field shifts to save the single.
So was the spike real? My answer: the spike got spiked, but the pattern stayed in the data — and extracting it is the work in front of us.